Go back to Chapter 5, skip to Chapter 7 or return to the Index
6.0 Auralization Caveats
6.1 Baseline - ITD, ILD, HRTF
6.2 Bandwidth limiting
A number of caveats have been identified and addressed throughout this paper; items which are easily forgotten when constructing an auralization system, but are essential for its proper operation. A summary of these findings follows:
The need for specification at every level of the auralization process was addressed in section 1.3, with a list of the pertinent variables in an auralization system and the effect each has on the final result. While some of these issues (such as headphone response and head movement) have been addressed in present systems, many have escaped mention in the literature. The necessity of meticulously specifying the recording conditions for both HRTF and source had not previously been brought to light.
The problems introduced by ILDs and ITDs intrinsic to the HRTF were discussed in Chapter 3, along with means for a solution. Methods for the removal of these imbedded characteristics were developed and implemented.
The HRTFs were examined in Chapter 4, including a suggestion for a new method of recording them. Problems related to the artificial pairing of individual ear responses were observed and again, a solution proposed.
These items are all results of the research work performed on this project, though in a somewhat different way from the audible products of the software. They are however, a significant consequence of this effort.
The conventional implementation presented here successfully generates source positioning for nearly all angles, bounded only by the limitations of the SDO HRTFs. These restrictions affect only large deviations in elevation, and are not a primary concern. The approximation used for these unusual cases is sufficient.
A number of different sources were used, varying from percussive drum
sounds to human voice. Figure 6.1 shows a raw sample of the word "sound"
spoken by a male voice, before processing. The sound was recorded as a mono,
16-bit, 44.1 kHz file. Figure 6.2 is the raw sound's spectral content, with
the confidence interval indicated as well. Spectral content was analyzed
with an FFT using a Hanning window and 50% overlap. An examination of the
spectral content shows that at one quarter the sampling frequency (11 kHz),
the signal content is down to -60 dB (![]() ). The inherent signal-to-noise
ratio (SNR) of the soundcard used to record and play back these samples
is approximately 62dB. Therefore, at 11 kHz, this voice sample has effectively
vanished into the noise floor. This supports the statements made in Chapter
5 regarding the bandwidth-limited nature of commonly used signals.
). The inherent signal-to-noise
ratio (SNR) of the soundcard used to record and play back these samples
is approximately 62dB. Therefore, at 11 kHz, this voice sample has effectively
vanished into the noise floor. This supports the statements made in Chapter
5 regarding the bandwidth-limited nature of commonly used signals.
This sample was then processed with the conventional auralization algorithm, for a source position of 90º azimuth, 0º elevation, 1 meter distance. The resulting stereo .wav file is displayed in figure 6.3. The power spectrum for this file is also given, in figure 6.4. The effects of the HRTF filtering are visible in the difference between the left and right channel spectra. The ILD is evident from the time domain graph, and zooming in on a section of the signal displays the ITD, as in figure 6.5. It is most noticeable by comparing the position of the trough just before 6300 on the right channel with the same trough just past 6300 on the left.
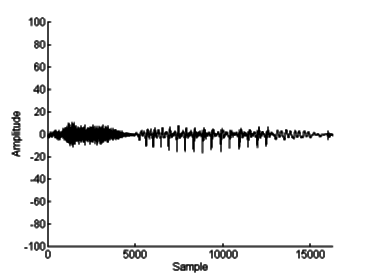
Figure 6.1: Raw sample of "sound" spoken by a
male voice.
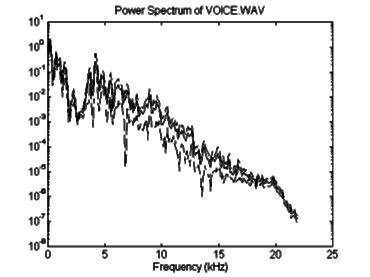
Figure 6.2: Frequency spectrum of "sound" spoken
by a male voice (before processing).
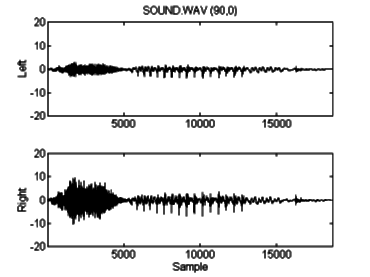
Figure 6.3: Male spoken "sound" after auralization
placement at (90,0,1).
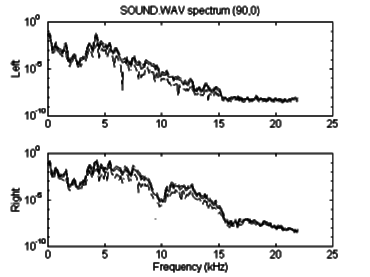
Figure 6.4: Spectral content of "sound" after
auralization to (90,0,1).
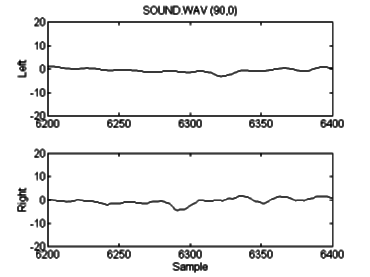
Figure 6.5: A close-up of the middle of "sound",
exhibiting interaural delay
The results from the optimized code are visually very similar to those from the classic algorithm. Figure 6.6 shows the time-domain response, and figure 6.7 is the spectral power of the "sound" sample after processing by the optimized algorithm. The aliasing visible about 11 kHz is the result of using a simple linear interpolation to upsample the output of the program. A short FIR low-pass filter could be added to further reduce these aliased frequencies, if necessary. The aliasing visible here contains little power and will likely have a negligible effect on the perceived sound.
To validate this approach, it is necessary to look at the overall effect of the optimizations; this is performed in the next chapter.
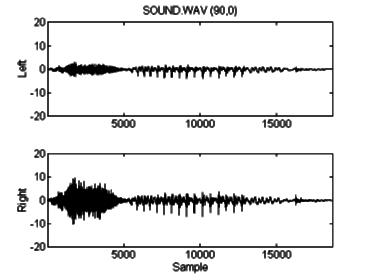
Figure 6.6: The same voice sample ("sound") processed
with optimized code.
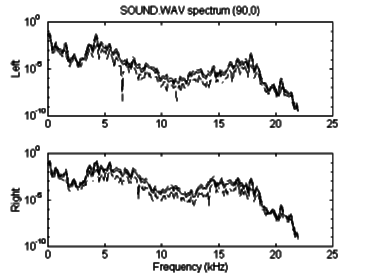
Figure 6.7: Frequency response of "sound" using
optimized algorithm.