Go back to Chapter 6,
skip to Chapter 8
or return to the Index
Chapter 7
VALIDATION
7.0 Residue measurement
7.0 Residue measurement
The optimizations presented in Chapter 5 have been shown to greatly reduce the computation time
necessary for auralization processing, but at what cost? To examine the effects of the optimization, it is
useful to employ a residue evaluation. The residue is simply the difference between the original
(conventionally auralized) result and the result generated by the optimized algorithm. This now contains
only those signal features which have changed.
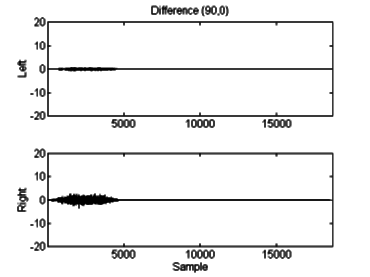
Figure 7.1 is a graph of the residue for the spoken word "sound". The only place where there is
significant change is at the beginning of the word, at the sibilant "s". This is to be expected somewhat, as
the "s" is a broadband sound closely related to white noise. The amount of residue present during the "s"
may be symptomatic of a non-optimal threshold for switching between the two modes of the optimized
algorithm; it may indicate that the algorithm did not switch to the "high bandwidth" mode at the beginning
of the word. However, the lack of appreciable residue during the rest of the word does demonstrate the
validity of the technique for band-limited signals.
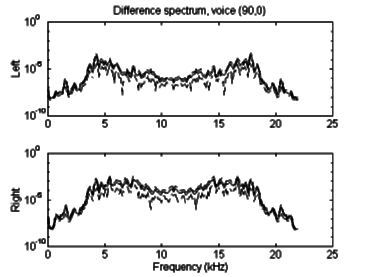
An examination of the spectral content of the residue (figure 7.2) reveals several items of note. First,
the spectral energy of all components removed is very low, below -60dB (
 ). Second, there is
aliasing about 11 kHz. This was expected, as a side effect of reducing the sample rate. Since the source
was already determined to have very little power above 11 kHz, the removal of more of these energies is
inconsequential.

Figure 7.1: Difference signal between original and optimized algorithms for "sound".

Figure 7.2: Spectral content of difference signal.
Continue on to Chapter 8...
Frank Filipanits Jr.
-
franko@alumni.caltech.edu
 ). Second, there is
aliasing about 11 kHz. This was expected, as a side effect of reducing the sample rate. Since the source
was already determined to have very little power above 11 kHz, the removal of more of these energies is
inconsequential.

